Monitor logs and troubleshoot issues
Monitor logs and troubleshoot issues
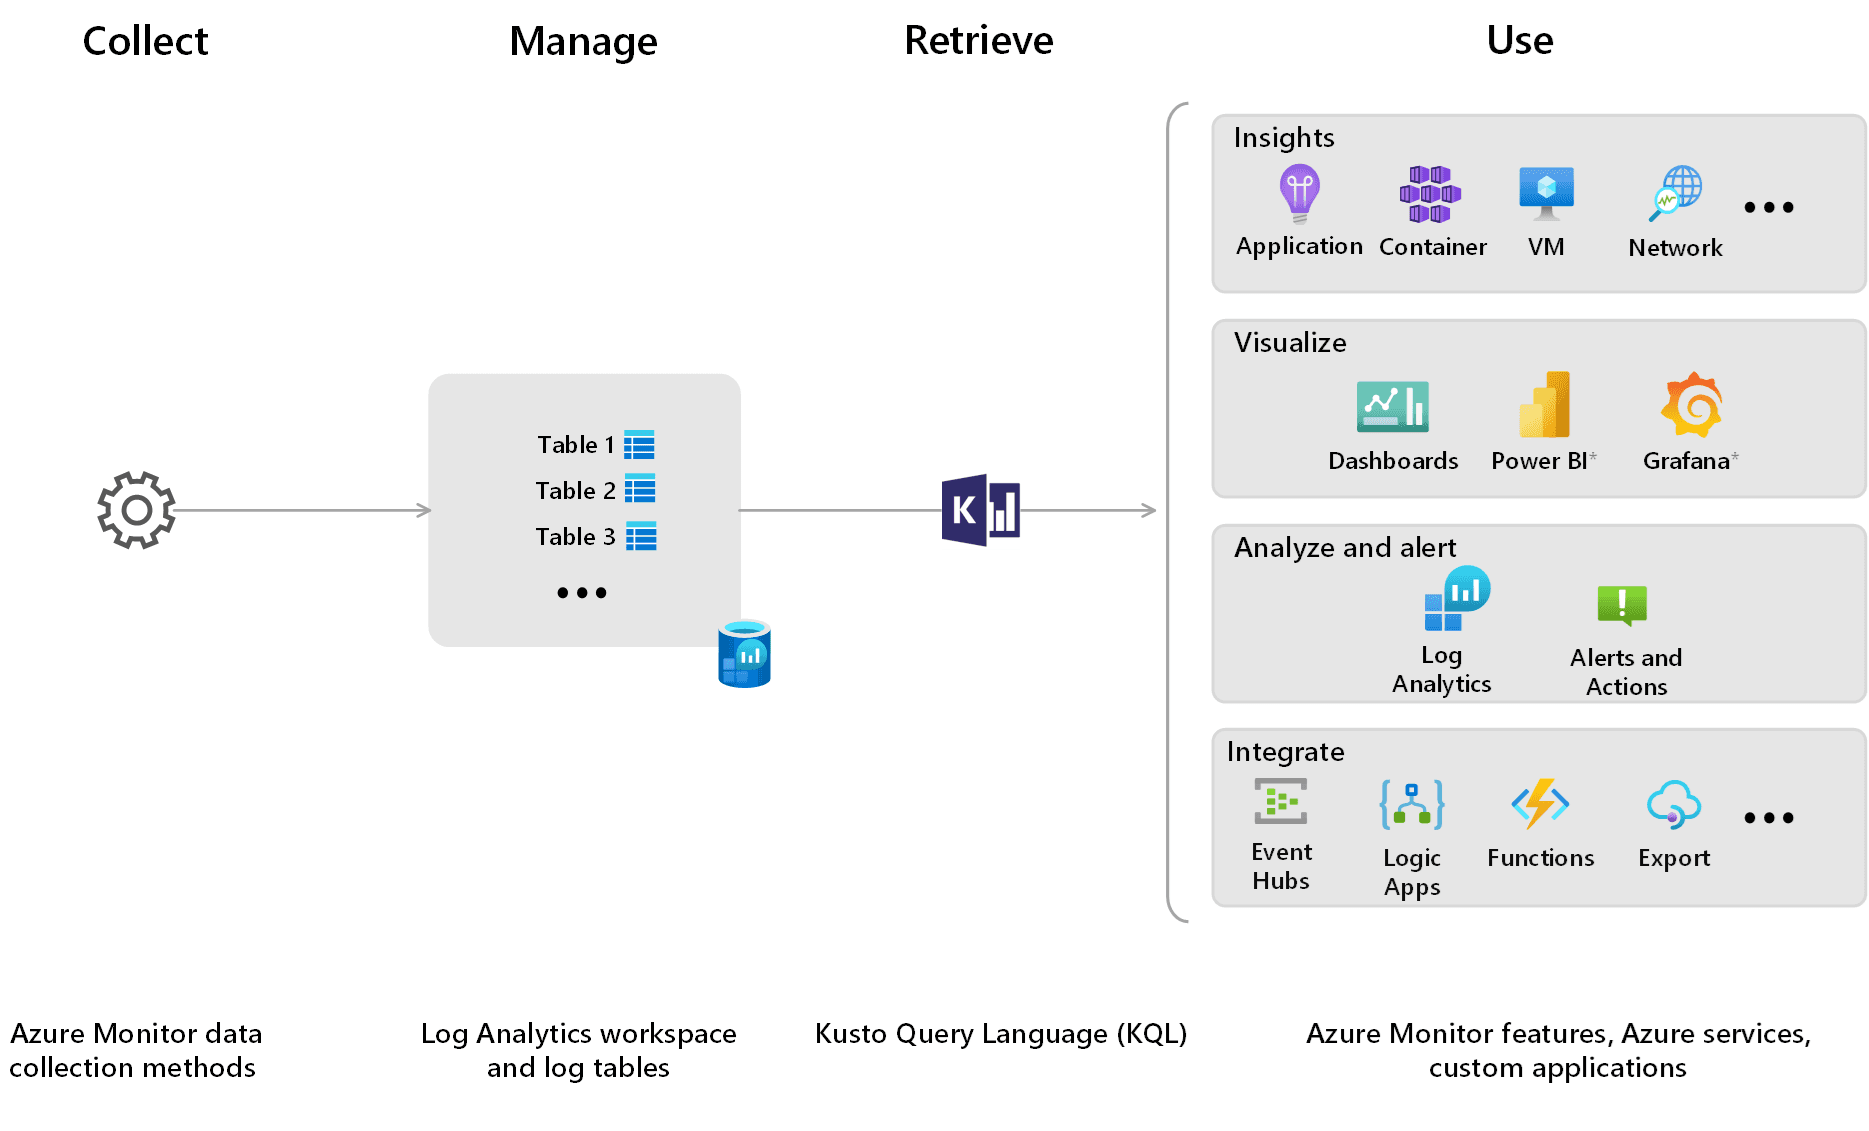
Logs are the primary diagnostic signal in a managed container platform. In an AI solution, logs help you correlate requests with model versions, explain latency spikes, and identify dependency failures without needing shell access to containers. Azure Container Apps integrates with Azure Monitor, and you can also stream logs during an incident.
Note: Log access depends on how your Container Apps environment is configured. Validate that your environment is connected to Log Analytics or that your operational workflow uses log streaming for real-time investigation.
The Two Modes of Debugging: "Live TV" vs. "DVR"
When troubleshooting a cloud application, you have two primary tools at your disposal:
flowchart LR
    classDef aca fill:#762C9D,stroke:#762C9D,color:#fff,rx:5px
    classDef term fill:#1E1E1E,stroke:#333,color:#4AF626,rx:5px
    classDef db fill:#68217A,stroke:#68217A,color:#fff,rx:5px

    App[Azure Container App]:::aca

    %% Live TV flow
    App -- "Live Streaming\n(az containerapp logs show)" --> Term1[Your Terminal\n'Live TV']:::term

    %% DVR flow
    App -- "Continuous Export\n(Saved forever)" --> DVR[(Log Analytics Workspace\n'The DVR')]:::db
Term2[Your Terminal\n(az monitor log-analytics query)]:::term -. "KQL Historical Search" .-> DVR- Log Streaming (Live TV): Using
az containerapp logs showis like watching a live security feed. You see events exactly as they happen in real-time. However, if you look away or if the container crashes, those live logs vanish from the screen. - Log Analytics (The DVR Recording): Every log your container prints is silently shipped to a database called a Log Analytics Workspace. If an error happened at 3 AM while you were sleeping, you use KQL queries to search the "DVR" history.
Use log streaming for real-time diagnosis (Live TV)
Log streaming is useful when you can reproduce an issue quickly, such as triggering an exception via an API request while watching your terminal.
az containerapp logs show \
  --name <app-name> \
  --resource-group <resource-group> \
  --follow
Query historical logs with KQL (The DVR)
Azure uses Kusto Query Language (KQL) to search the Log Analytics database. Think of KQL like an assembly line in a factory. The | (pipe) symbol moves the data to the next station on the conveyor belt:
- Dump all logs onto the belt (
ContainerAppConsoleLogs_CL) - Filter out the noise (
| where ContainerAppName_s == 'ai-api') - Grab the columns you want (
| project TimeGenerated, Log_s) - Sort them (
| order by TimeGenerated desc)
az monitor log-analytics query -w <WORKSPACE_ID> \
    --analytics-query "ContainerAppConsoleLogs_CL | where ContainerAppName_s == '<app-name>' | project TimeGenerated, Log_s | order by TimeGenerated desc | take 20" \
    -o table
Design logs that support AI troubleshooting
AI services often behave differently for different inputs, and that makes troubleshooting harder if logs don't capture enough context. You want enough detail to debug safely, but you also want to avoid logging sensitive content. A balanced approach is to log identifiers and metadata rather than raw documents or prompts.
Recommended fields to include in application logs:
- Request identifier: A correlation ID that you propagate across services.
- Revision or build identifier: A value that matches your image tag or digest, or a version string baked into the image.
- Model version: The model deployment name or version used for the request.
- Latency breakdown: Total time and, when possible, key dependency timings.
Troubleshoot revision-specific failures
Revision failures often fall into a few categories: startup failures, probe failures, configuration errors, or runtime exceptions. Logs help you identify which category you're facing. For example, an app might exit immediately due to a missing environment variable, or it might start successfully but fail readiness probes due to a wrong path.
During an incident, use a workflow that narrows scope quickly:
- Confirm which revision is active and which revision is failing.
- Stream logs while you reproduce the issue or while the failing revision starts.
- Compare configuration between a working revision and a failing revision.
- Apply a targeted fix and validate the next revision becomes ready.